
Learn how to identify and interpret the price recommendations, what might influens them and why the price sensitivity chart is useful.
This article consists of the following sections:
- Price recommendations
- Price limit reached
- Governing price boundaries
- Price insights
- Price sensitivity chart
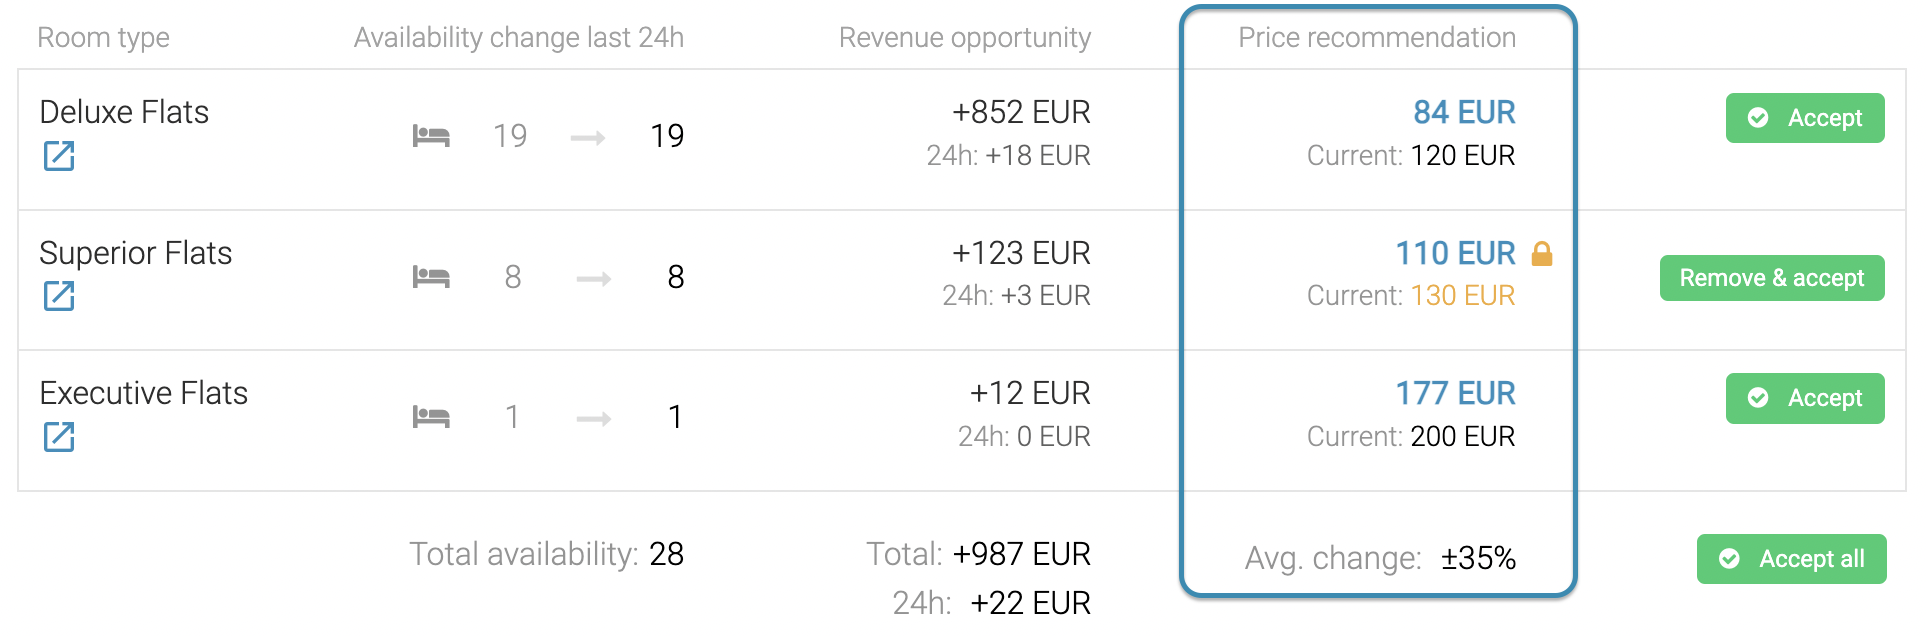
Price recommendations
If your property is not on Autopilot you need to accept the price recommendations.
A price recommendation that is awaiting approval is marked in blue throughout the system. To identify dates with price recommendations in the list view, look for the blue dot.

In the calendar view you can either see the recommended price in blue (if there is a recommendation for the room type you are currently studying) or as a blue dot (for other room types).

When expanding a stay date you will see price recommendations in blue, and the current price in grey below. If you have an override in place, the current price will instead be orange.
Price limit reached
The price recommendations in Atomize are designed to always stay within the user defined price boundaries (configured in the Price hierarchy page or overridden by a price hierarchy override).
To help you identify stay dates where your price limits might block potential revenue there will be icons displayed.

For properties on autopilot, the icon will be displayed when the current price hits a limit:

For properties not on autopilot, the icon will be displayed when the price recommendation hits a limit:

In the All stay dates list, it is possible to use the filter to filter out all stay dates where the price boundaries are reached, ensuring you can easily identify dates with more revenue opportunities.
Governing price boundaries
In order to better asses price recommendations and current prices, you are able to view which price hierarchy is ruling on each stay date and room type, as well as its values.
You can see the information in the expanded room type view.
Price insights
In the expanded room type view, you can see the price insight section. This will help you as a user gain a deeper understanding of the price adjustments the system provides.
The section contains the three following parts:
- Price explanation - an explanation of why the system suggests a certain price change for that room type and stay date. The explanations are provided by a generative AI model.
-
Estimated demand vs availability - A value showing the estimated demand compared to how the availability is on the room type.
-
Selection of historical reference dates - A price adjustment is based, among other things, on analyzing multiple historical dates and their data points, this is a selection of those dates.

Price sensitivity chart
To better understand the reason for the price recommendations, open up the room type and study the figures and graphs. The price sensitivity chart is especially useful as it is a graphic representation of the decision behind every pricing decision. It illustrates the revenue and occupancy opportunity based on customers’ perceived willingness to pay for a particular room type on a particular day, clearly identifying the optimal price point. The chart also shows the confidence level of the pricing decision based on the quality and quantity of data available to model the demand. The chart will update in real time if the customer subscribes to real-time optimization.
Watch the video below to learn how to review a price recommendation and a detailed description of the logic behind the price sensitivity chart:
If you want to learn more about how to accept your price recommendations, visit the article Accepting price recommendations.
For more information about how the price recommendations are calculated, visit the FAQ chapter Price Recommendations.